← All boards
Educational › Basic Principles

Psychoacoustics Educational Example1

Plays on the mobile app
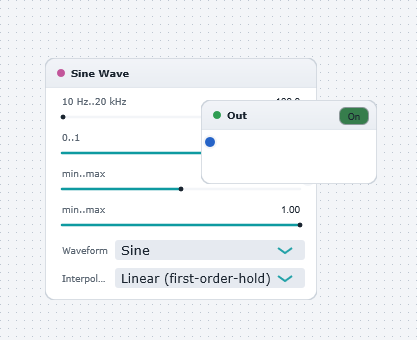
The Psychoacoustics Educational Example1 board in the WaveWarp DrawingBoard
Psychoacoustics Educational Example1 — the board as it opens in the WaveWarp DrawingBoard.

What it does

PsychoacousticsEducationalExample1

Simple DrawingBoard for illustrating the well-known psychoacoustical phenomenon of frequency-dependent loudness perception.

Play the DrawingBoard with the Signal Generator set at 100 Hz (default). Now increase the frequency to 200 Hz, without changing the amplitude or the volume setting of your soundcard or external amplifier. You will note that the 200 Hz signal "seems" louder than the 100 Hz signal, even though the signal amplitude (intensity) is the same for both. Now increase the frequency to 500 Hz, then 1000 Hz, then 4000 Hz. You will note a corresponding increase in the perceived loudness. Now increase the frequency to 5000 Hz, then 7000 Hz, then 10000 Hz, then 15000 Hz. You will note that the perceived loudness progressively decreases with frequency, for frequencies above about 4000 Hz.

These experiments demonstrate the well-known Fletcher-Munson curves which relate the frequency-dependent perceived loudness to the physical intensity.

[Ref: F Richard Moore, Elements of Computer Music, P T R Prentice Hall, 1990 (section 1.7)].

Effects used

2 blocks 1 connection
In WaveWarp, 1998

How the original documented it

PsychoacousticsEducationalExample1 Simple DrawingBoard for illustrating the well-known psychoacoustical phenomenon of frequency-dependent loudness perception. Play the DrawingBoard with the Signal Generator set at 100 Hz (default). Now increase the frequency to 200 Hz, without changing the amplitude or the volume setting of your soundcard or external amplifier. You will note that the 200 Hz signal "seems" louder than the 100 Hz signal, even though the signal amplitude (intensity) is the same for both. Now increase the frequency to 500 Hz, then 1000 Hz, then 4000 Hz. You will note a corresponding increase in the perceived loudness. Now increase the frequency to 5000 Hz, then 7000 Hz, then 10000 Hz, then 15000 Hz. You will note that the perceived loudness progressively decreases with frequency, for frequencies above about 4000 Hz. These experiments demonstrate the well-known Fletcher-Munson curves which relate the frequency-dependent perceived loudness to the physical intensity. [Ref: F Richard Moore, Elements of Computer Music, P T R Prentice Hall, 1990 (section 1.7)].

Components used (1998)

Sine Wave GeneratorOutput Single-Mono WAVE Driver